Before reading this page, you should have a basic understanding of the difference between video latency and input lag. It is also important to note that video latency definitions on this website apply to consumer electronics technologies with raster scanning (or similar) video transport interfaces.

Because displays may present a video signal differently than how it was initially transported, it becomes difficult to simply describe how video latency should be measured. For example, a display may buffer each frame before presenting the frame all at once rather than gradually scanning out the frame as it is transported — this results in different video latency at different points on the display. How audio should be synchronized to this modified video stream may be dependent on the exact situation. The following examples describe how video latency should be measured for many of these sorts of scenarios.
Video latency may be measured at the center or top of the screen. Measurements at the center of the screen are most common in the industry.1, 2 This is likely because the parts of video that must be synchronized with audio, such as lip movements, are most often near the center of the screen. Regarding video latency measurements for interactive systems, disregarding audio synchronization, measurements at the center of the screen typically represent the average video latency of all parts of the screen. If there is a visual focus to an interactive system, such as a character of an action video game, this focus is often near the center of the screen.
This website is only concerned with measurement of sink devices. This means it is assumed that the source (e.g. game console, set top box, blu-ray player) and transport (e.g. HDMI, composite, etc.) are perfectly synchronized and the viewing / listening position is not accounted for.
Index
Simple Examples:
- 0 ms of Audio and Video Latency
- 50 ms of Audio and Video Latency
- Simple AV Sync Error
- Faster Output Refresh
- Entire Frame at Once
- Rotation Video Processing (90°)
- Rotation Video Processing (180°)
- Quick Frame Transport (QFT) with Slow Presentation
- Stereoscopic 3D
LCD Response Time:
Variable Video Latency:
- Notes on Variable Video Latency
- Progressive Scan 3:2 Pull Down (Motion Judder)
- DLP Color Wheel Projector
- Inconsistent Backlight (Flicker)
Modified Video:
Simple Examples
0 ms of Audio and Video Latency
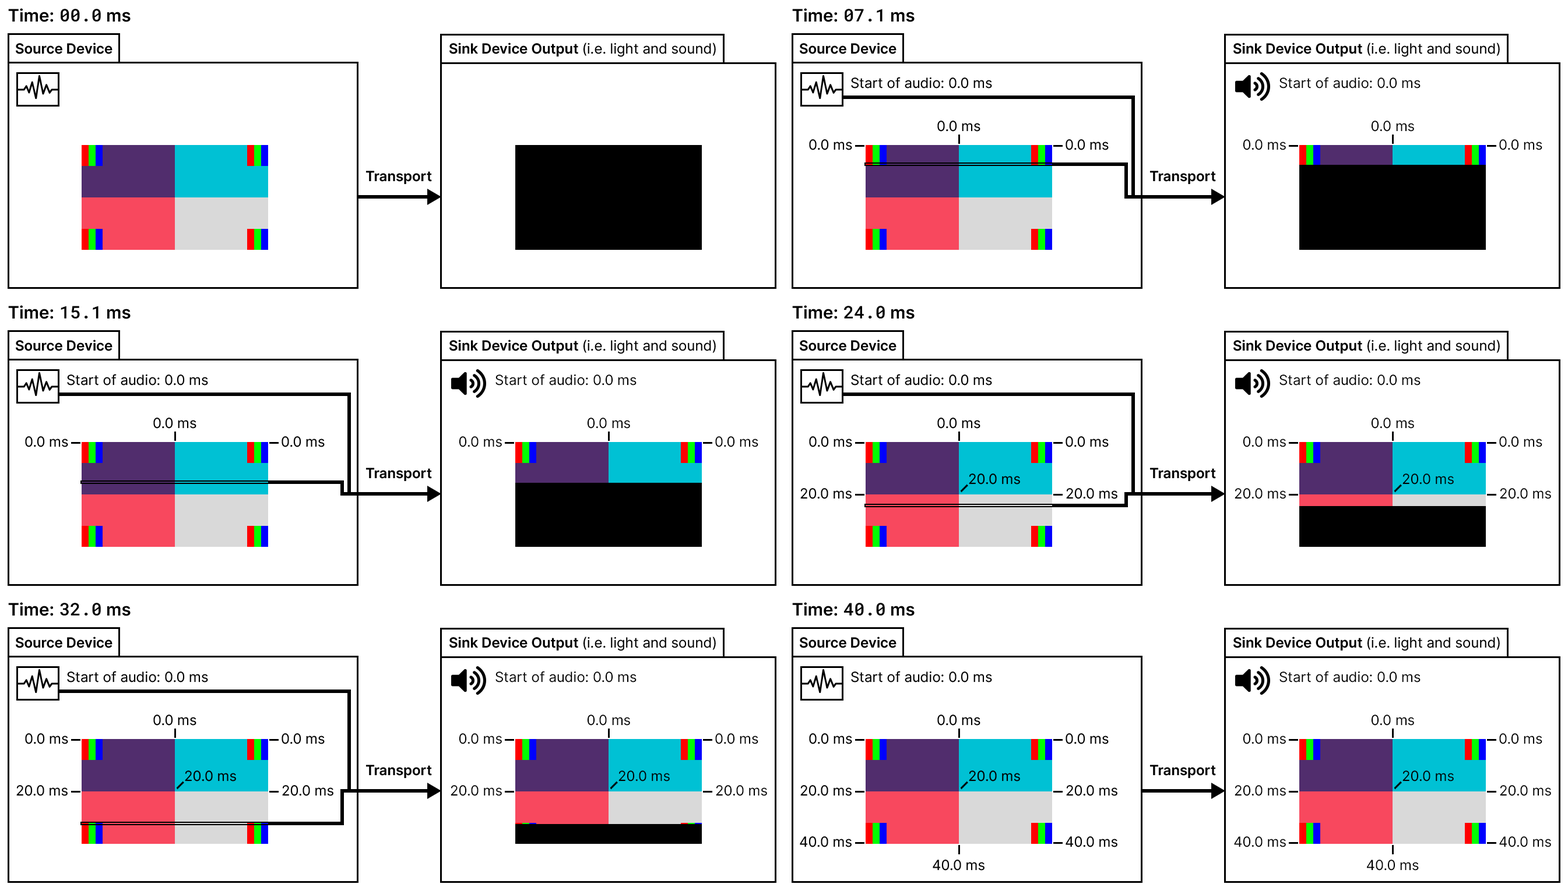
| Video latency: | 20 ms − 20 ms = 0 ms |
| Audio latency: | 0 ms − 0 ms = 0 ms |
| AV sync error: | 0 ms − 0 ms = 0 ms |
| Notes: | An example is a CRT display and analog sound system with an analog transport interface, such as VGA, composite, etc. |
50 ms of Audio and Video Latency
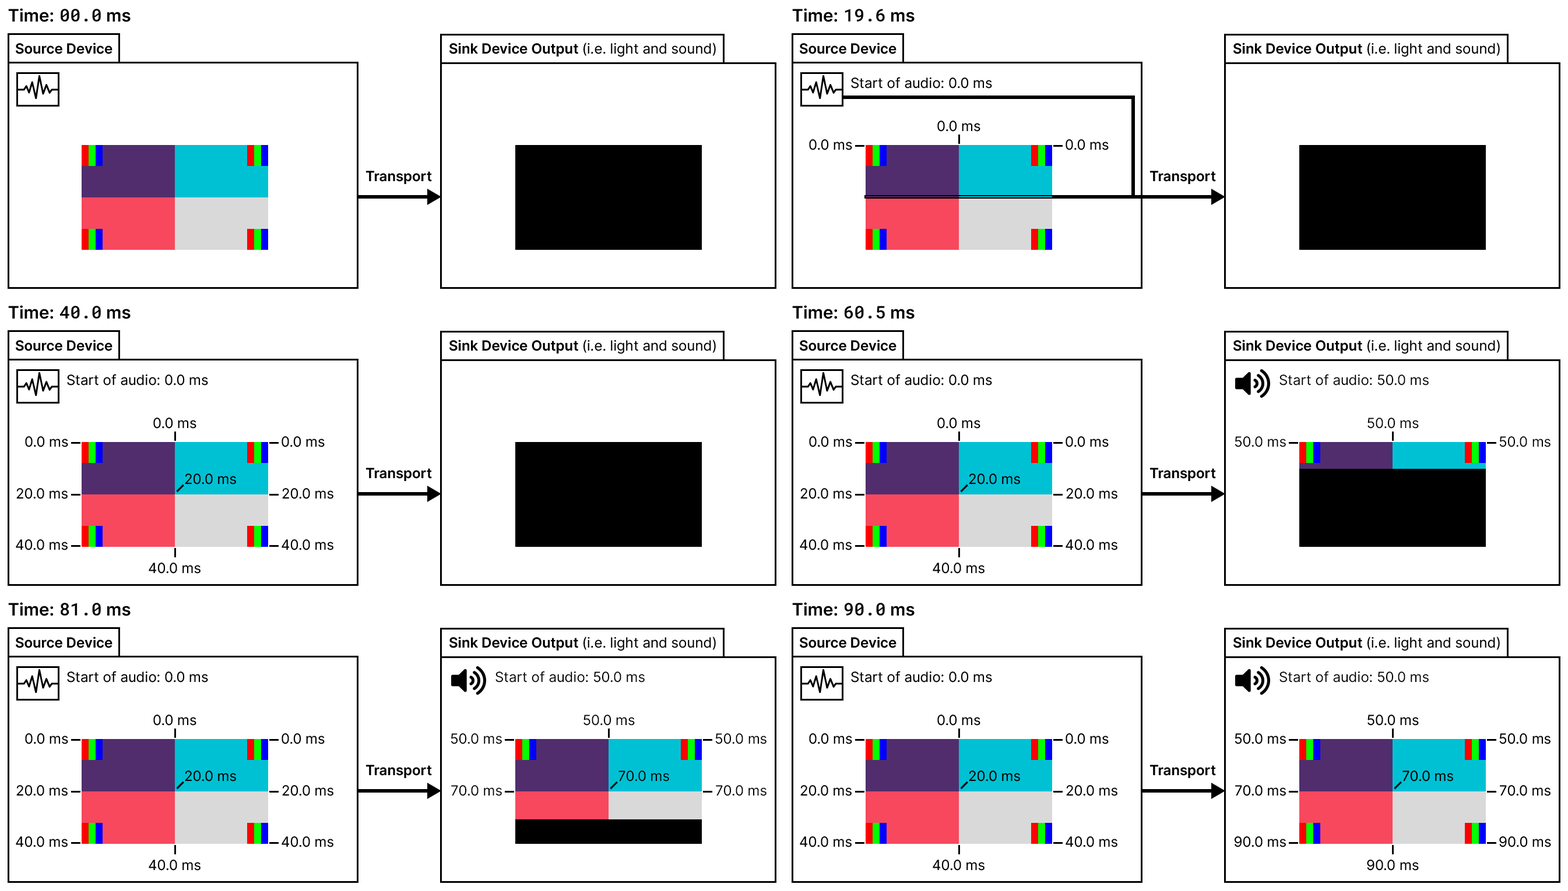
| Video latency: | 70 ms − 20 ms = 50 ms |
| Audio latency: | 50 ms − 0 ms = 50 ms |
| AV sync error: | 50 ms − 50 ms = 0 ms |
| Notes: | Physical presentation of the audio and video signal have been delayed by 50 ms. Video latency is the same at the top, middle, and bottom of the screen in this example. |
Simple AV Sync Error
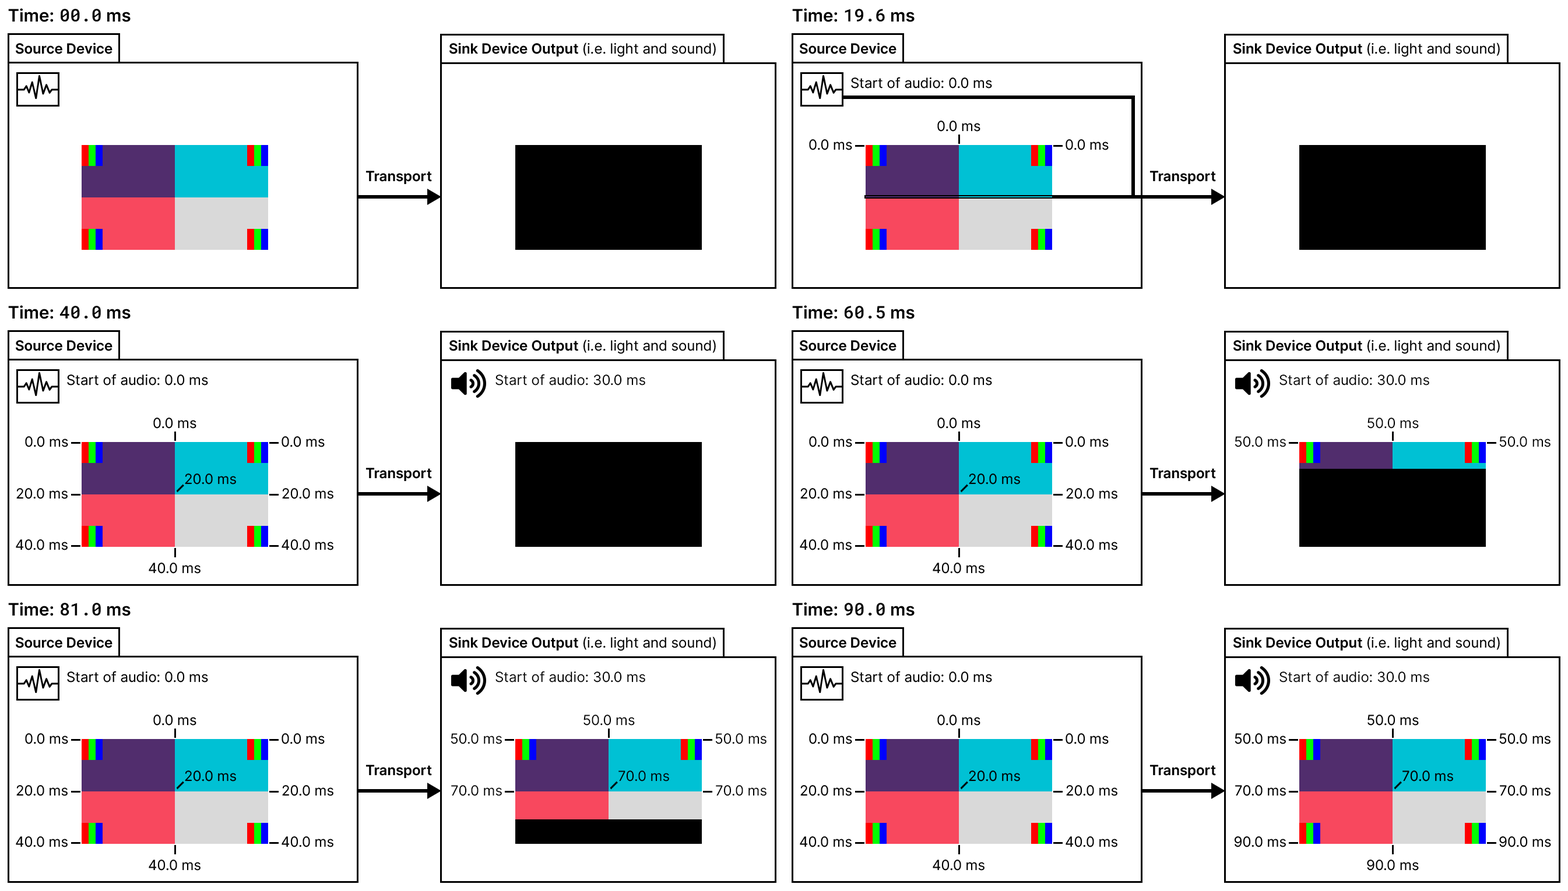
| Video latency: | 70 ms − 20 ms = 50 ms |
| Audio latency: | 30 ms − 0 ms = 30 ms |
| AV sync error: | 50 ms − 30 ms = 20 ms |
| Notes: | Physical presentation of the audio signal has been delayed by 30 ms and physical presentation of the video signal has been delayed by 50 ms. This results in a AV sync error of 20 ms. |
Faster Output Refresh
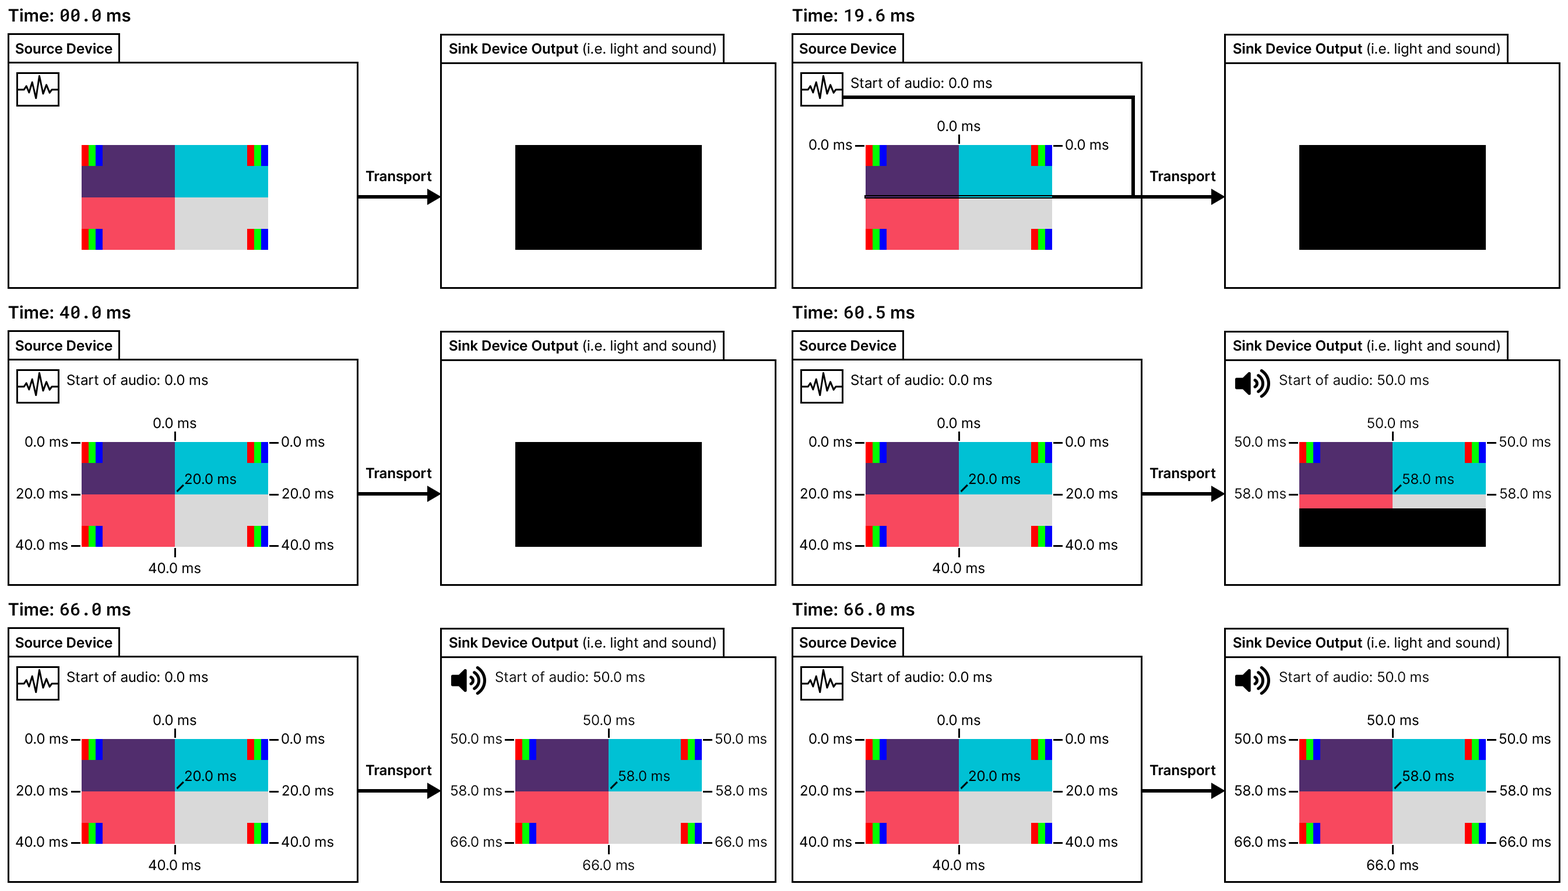
| Video latency: | 58 ms − 20 ms = 38 ms |
| Audio latency: | 50 ms − 0 ms = 50 ms |
| AV sync error: | 38 ms − 50 ms = -12 ms |
| Notes: | This type of video presentation is common in newer digital displays as a better alternative to pull down. When a display is capable of refreshing its image faster than the refresh rate of the video signal, a display may buffer earlier parts of a frame in order to present each frame at a rate that is faster than the original video signal. This results a longer period between the time when the bottom of the frame is presented and the time when the top of the following frame is presented. This presentation method results in a different video latency at different points on the screen. |
Entire Frame at Once
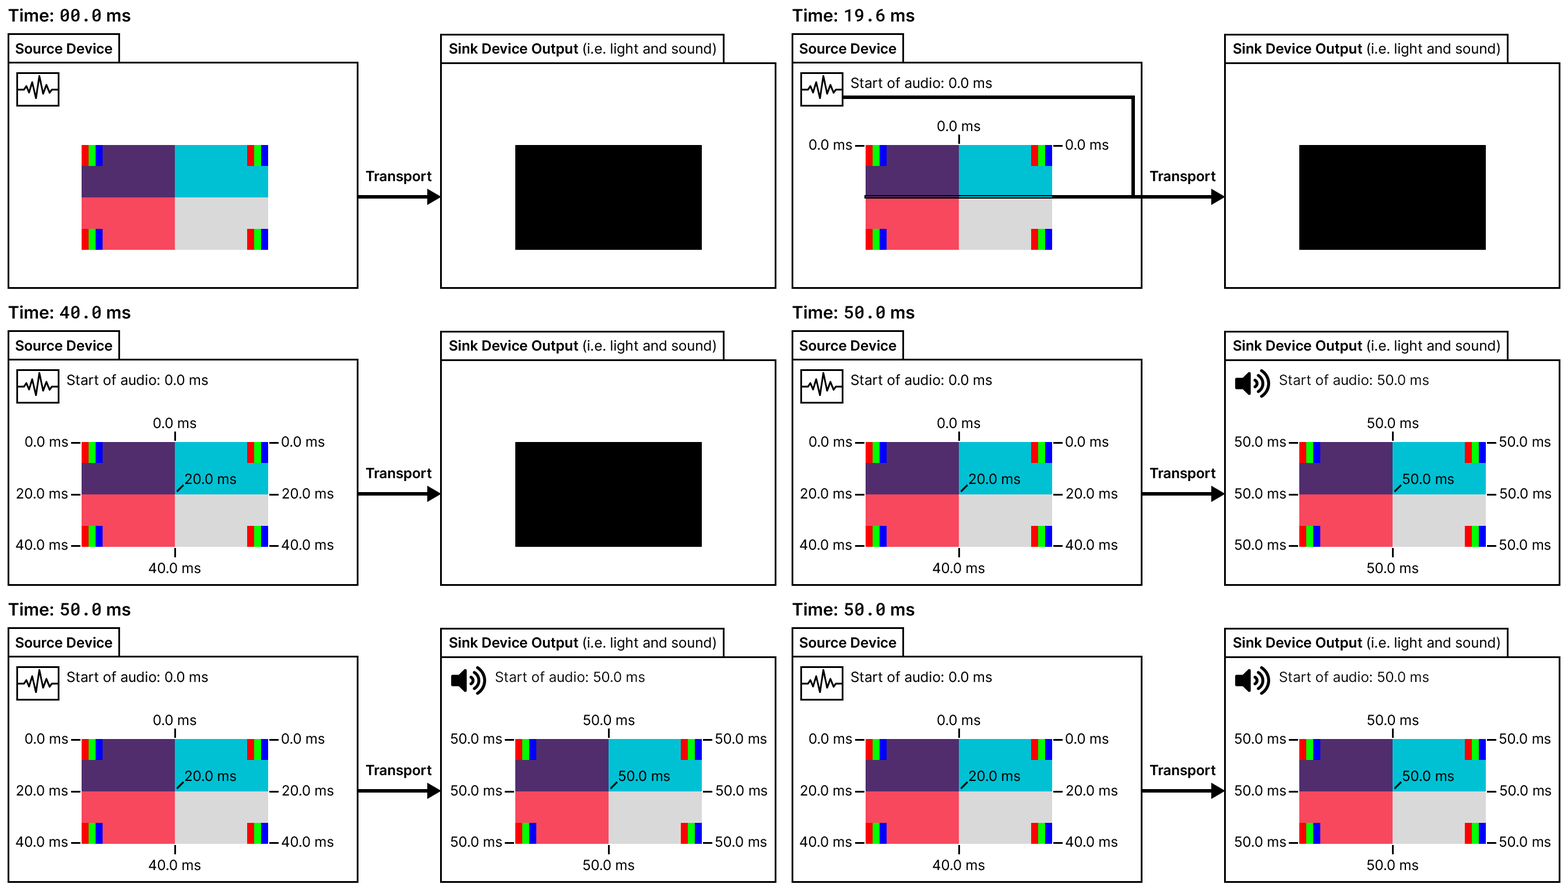
| Video latency: | 50 ms − 20 ms = 30 ms |
| Audio latency: | 50 ms − 0 ms = 50 ms |
| AV sync error: | 30 ms − 50 ms = -20 ms |
| Notes: | A display may buffer an entire frame before presenting. This presentation technique would likely be paired with some form of black frame insertion to allow the display to refresh its image during the time when the display is not lit. This presentation method results in a different video latency at different points on the screen. |
Rotation Video Processing (90°)
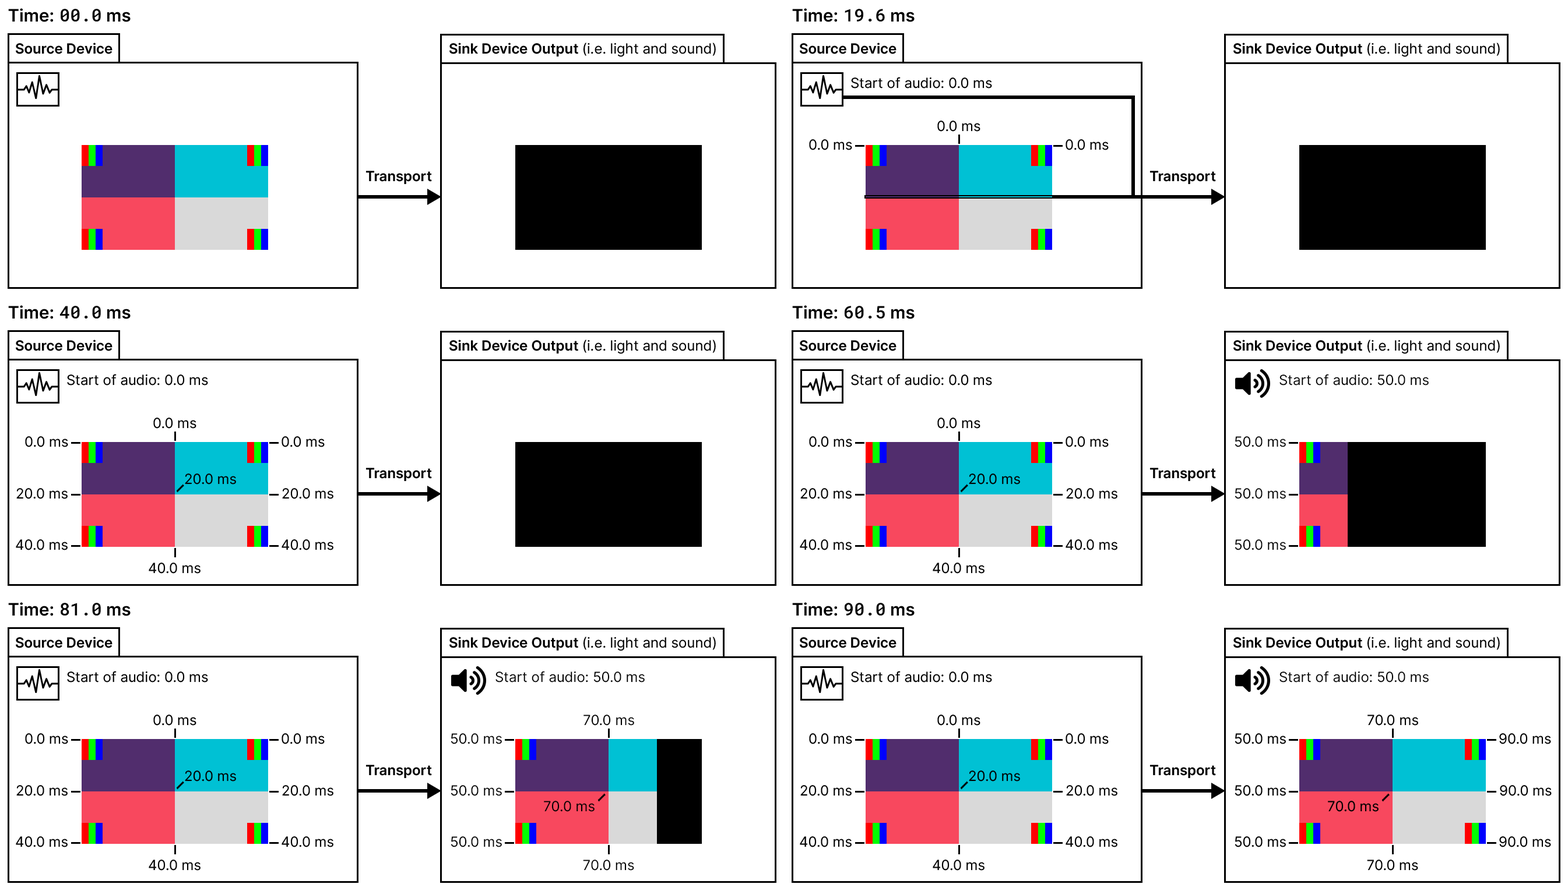
| Video latency: | 70 ms − 20 ms = 50 ms |
| Audio latency: | 50 ms − 0 ms = 50 ms |
| AV sync error: | 50 ms − 50 ms = 0 ms |
| Notes: | In this example, the transport interface provides a different scanning direction than the display. Because video latency is measured at the center of the display, the different scanning direction does not result in a different video latency. |
Rotation Video Processing (180°)
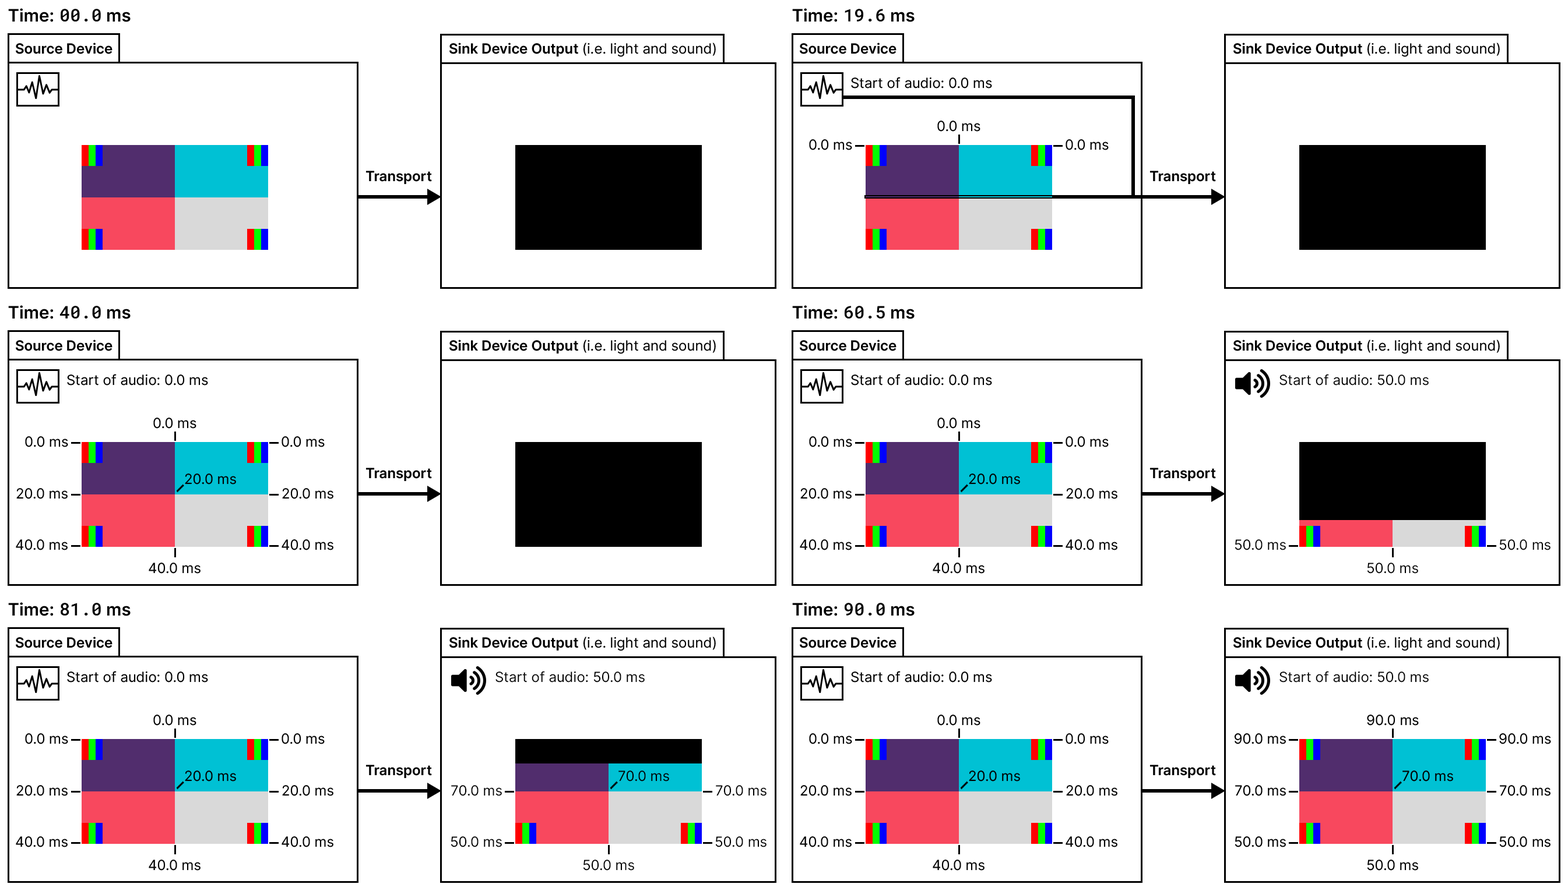
| Video latency: | 70 ms − 20 ms = 50 ms |
| Audio latency: | 50 ms − 0 ms = 50 ms |
| AV sync error: | 50 ms − 50 ms = 0 ms |
| Notes: | In this example, the transport interface provides a different scanning direction than the display. Because video latency is measured at the center of the display, the different scanning direction does not result in a different video latency. |
Quick Frame Transport (QFT) with Slow Presentation
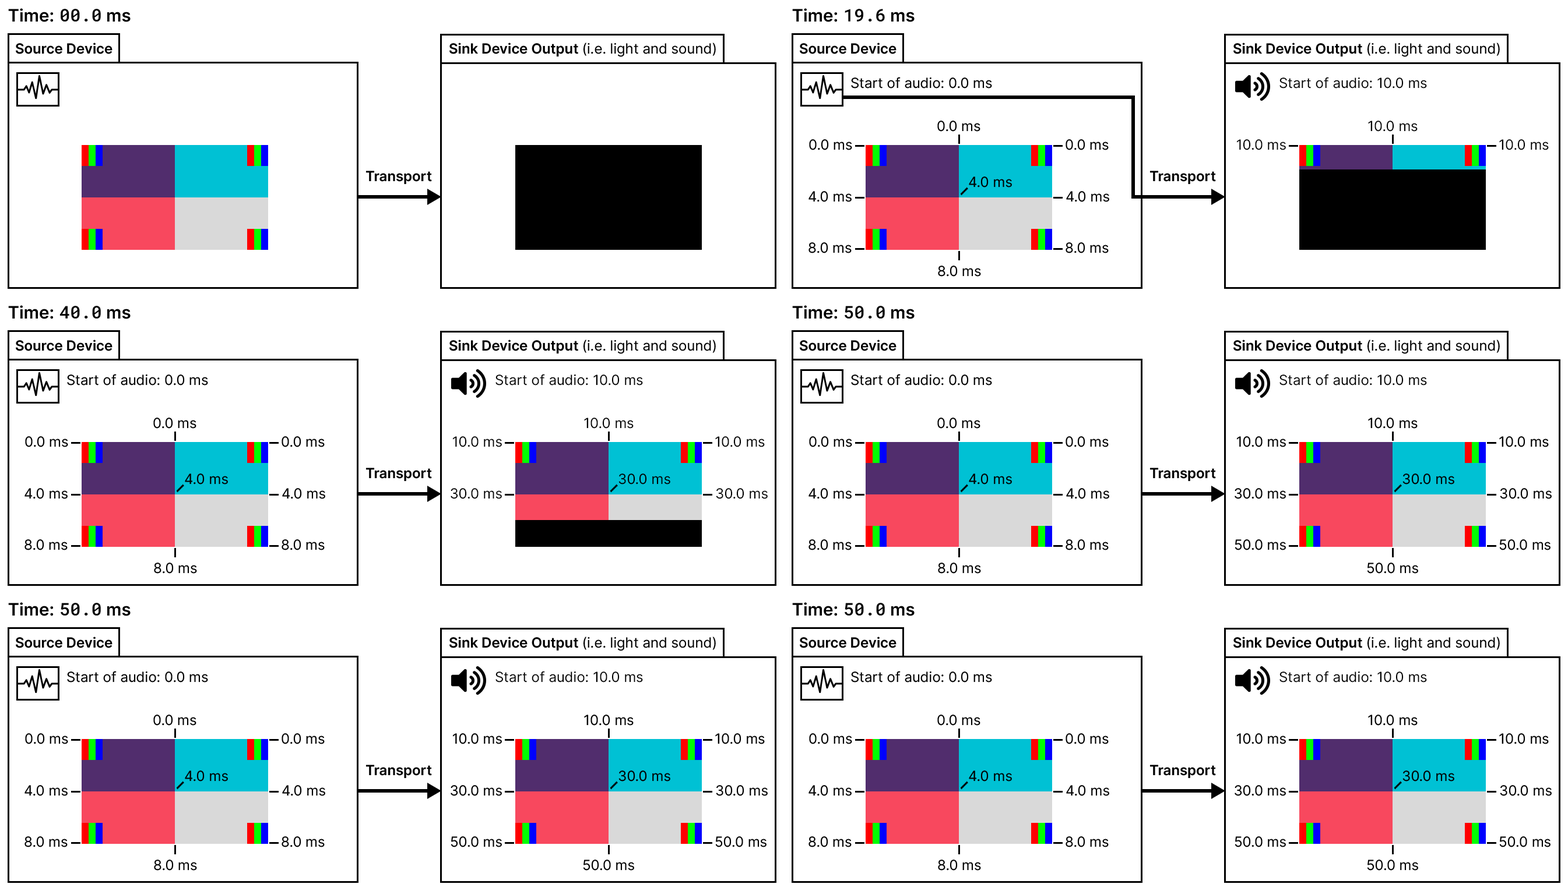
| Video latency: | 30 ms − 4 ms = 26 ms |
| Audio latency: | 10 ms − 0 ms = 10 ms |
| AV sync error: | 26 ms − 10 ms = 16 ms |
| Notes: | HDMI “Quick Frame Transport” paired with a display that slowly presents the frame. The video stream is 24 Hz, but frame transport is completed in only 8 ms instead of 40 ms. The display presents the frame over a 40 ms period instead of 8 ms. ⚠ Important note: This slow presentation is poor display behavior and defeats part of the purpose of QFT! Normally a display would present the frame at the same, faster rate that it was transported. This animation is provided to explain how video latency should be measured and how audio should be synchronized in this (hopefully only) theoretical scenario. |
Stereoscopic 3D
There are video signals that include two or more video streams, such as 3D video. The HDMI Specification 2.0 does not make any comments on the definition of video latency for these type of signals.
Author’s note: To follow with the existing definition of video latency for single-view video streams, video latency should be measured for each view as normal. If video latency is different per-view, then I believe that reporting the average of the two views is appropriate for audio/video synchronization and interactive systems.
LCD Response Time
Display technologies such as OLED, plasma, and CRT have negligible response time in relation to video latency. Conversely, LCD display technologies have a response time that is long enough to have a measurable impact on video latency.
LCD response time has an important influence in interactive systems and audio/video synchronization because a longer response time may delay the time when a change in image actually becomes visible to a viewer. The HDMI specification does not explicitly state whether a portion of this response time should be included in the definition of video latency. Most tools will not include a large portion of response time in their video latency measurements.3 The ICDM recommends measurements to be taken at the time when a black to white change has reached 50% of its full white luminosity.4 It is important to note that response time can vary greatly depending on what color is being transitioned to and from.
Author’s note: It is best to not attempt to add or remove response time from the reported video latency measurement of a given tool. For informational purposes, I have included details about how much response time is typically included in measurements from different tools on the Measuring Video Latency page.
Slow LCD Response Time
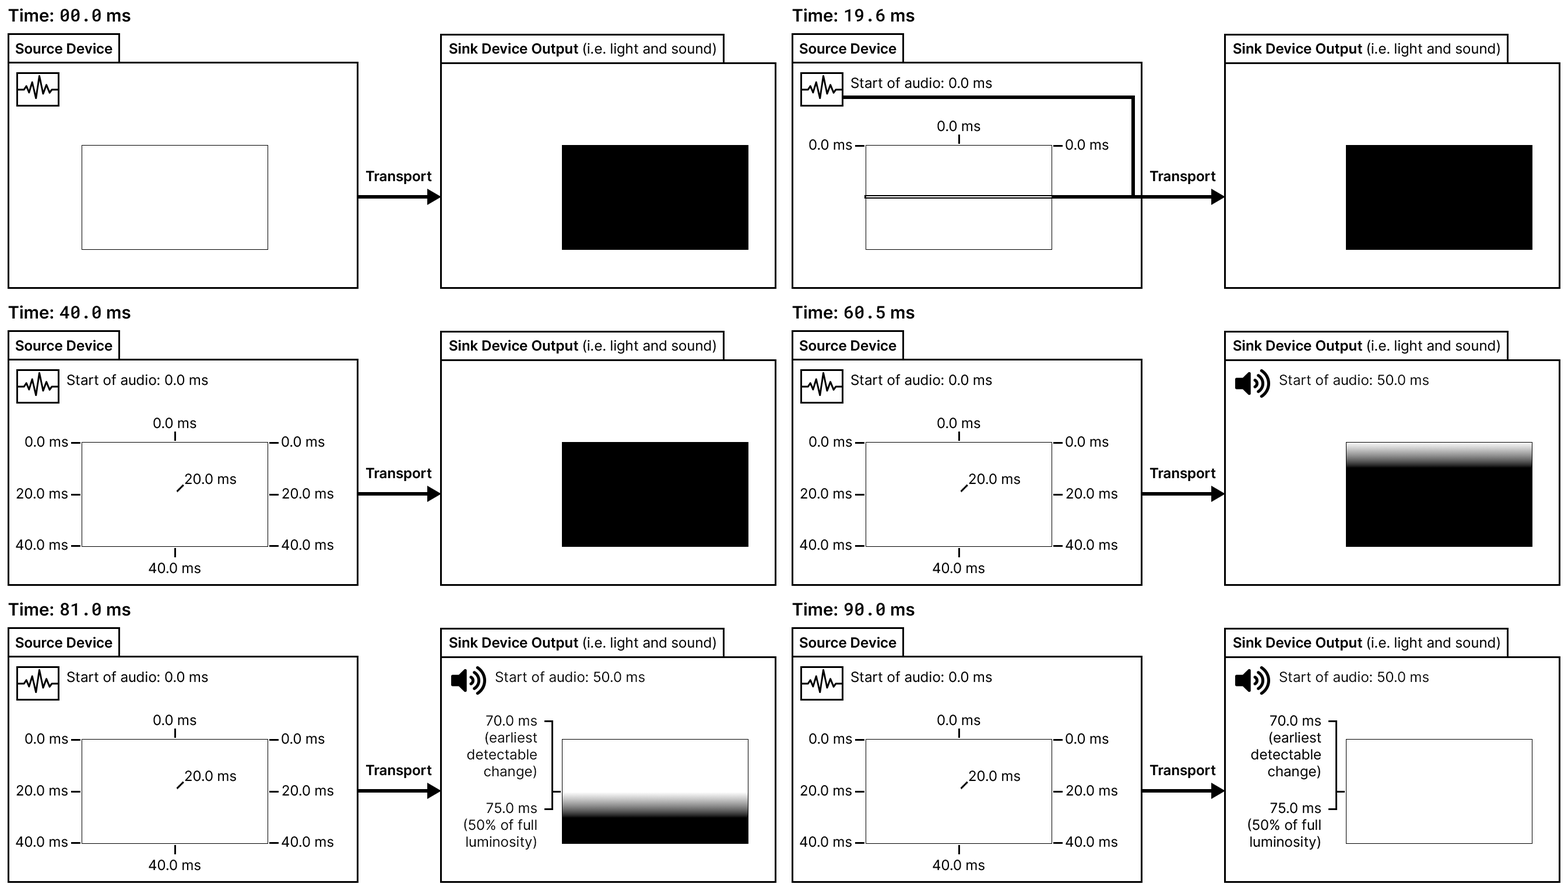
| Video latency (earliest detectable change): | 70 ms − 20 ms = 50 ms |
| Video latency (50% of full luminosity): | 75 ms − 20 ms = 55 ms |
| Audio latency: | 50 ms − 0 ms = 50 ms |
| AV sync error (earliest detectable change): | 50 ms − 50 ms = 0 ms |
| AV sync error (50% of full luminosity): | 55 ms − 50 ms = 5 ms |
| Notes: | For the sake of completeness, I have included measurements and calculations for the earliest detectable change in luminosity and the time when 50% luminosity has been reached. The value reported by a tool may be somewhere in between these two extremes; see the above text for details. This example shows a display that has a linear luminosity response that takes 10 ms to transition from full black to full white. |
Variable Video Latency
Sometimes video latency may be different for each frame, field, or color of a video signal. The ICDM recommends that minimum, maximum, and average video latency be reported,5 but this is unhelpful for audio/video synchronization because only one value can be used for calculating AV sync error.
Tools for measuring video latency may only report the average video latency, which is appropriate for many situations. Unfortunately, measuring the video latency of DLP projectors, which varies per-color, will likely not be handled correctly by a video latency measurement tool. An example of how video latency of DLP projectors should be measured is shown below.
Progressive Scan 3:2 Pull Down (Motion Judder)
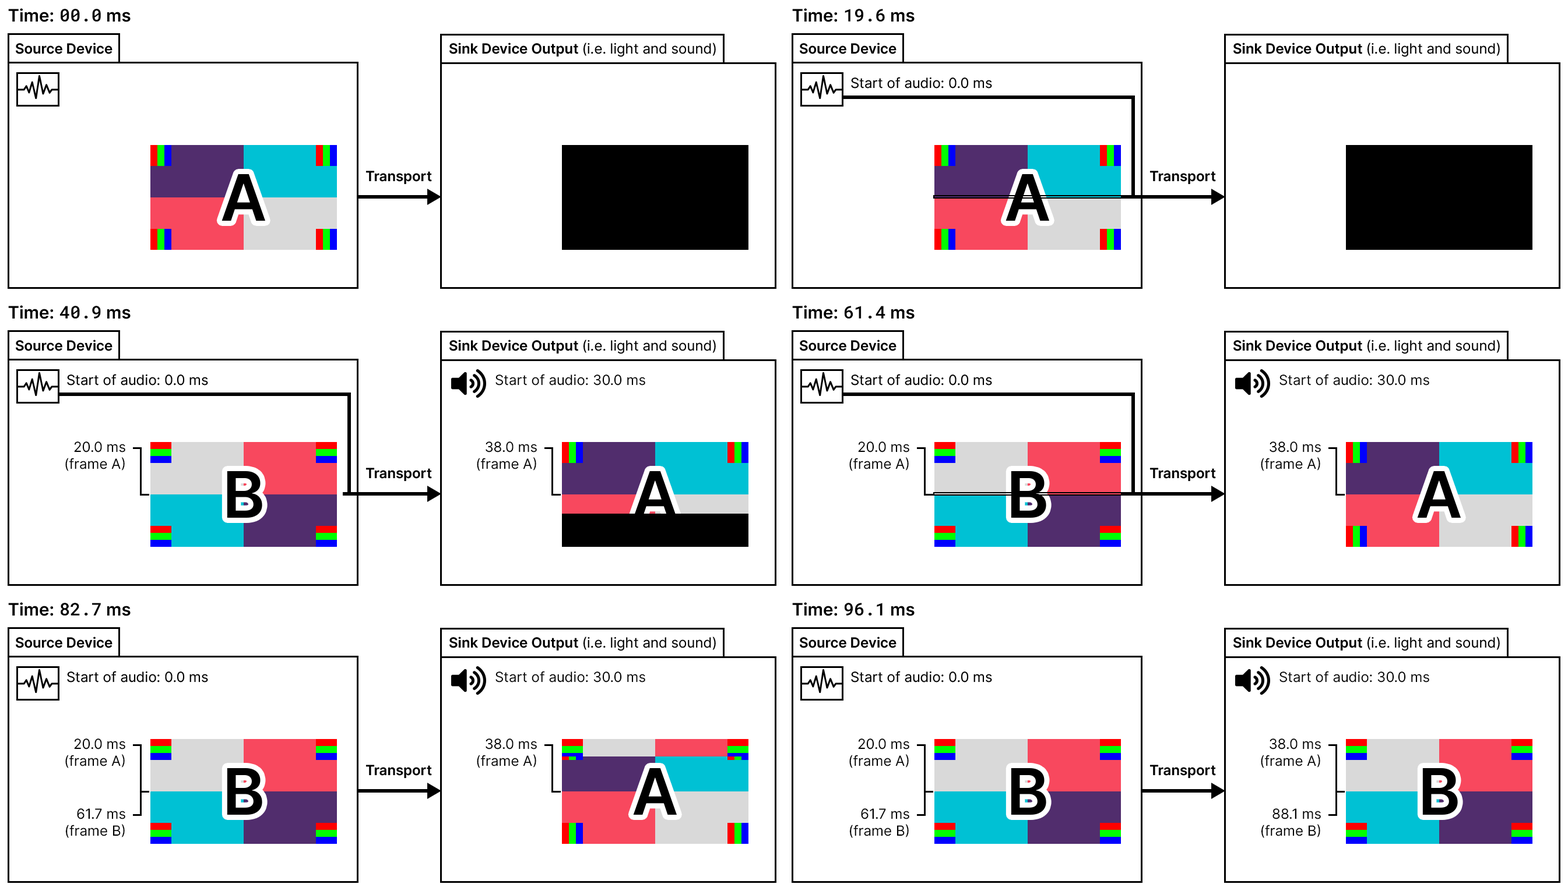
| Video latency (frame A): | 38.0 ms − 20.0 ms = 18.0 ms |
| Video latency (frame B): | 88.1 ms − 61.7 ms = 26.4 ms |
| Video latency (average): | (18.0 ms + 26.4 ms) / 2 = 22 ms |
| Audio latency: | 30 ms − 0 ms = 30 ms |
| AV sync error: | 22 ms − 30 ms = -8 ms |
| Notes: | This situation may occur when a 60 Hz display receives a 24 Hz progressive scan video signal. In this case, half of the video signal’s frames will be displayed for 2/60th of a second and the other half will be displayed for 3/60th of a second. This introduces motion judder and is an alternative to the technique described in the Faster Output Refresh example. See “The cause of judder on 24p video” on RTINGS.com for more information on motion judder. |
DLP Color Wheel Projector
A DLP color wheel projector presents one primary color at a time instead of presenting all primary colors at once. This means that video latency will be different for each primary color. For example, a pure red image in a video signal will have a higher video latency than a pure blue image. A DLP projector may have more than three primary colors.6 It is possible that some laser projectors or laser TVs have a similar behavior of presenting primary colors one at a time.
The behavior of displaying primary colours sequentially makes measuring video latency difficult. Most tools will only measure the video latency of the first primary color rather than the average or maximum latency.
An argument could be made that video latency should represent the time to complete color presentation because video latency is relevant to audio/video synchronization and AV sync issues are more perceptible when audio leads video than when video leads audio.7 This way, AV sync error calculations will correctly identify problematic audio/video synchronization where audio is presented before video that is coloured the same as the final primary colour. This perspective matches related comments in the HDMI specification which state that video latency should be “skewed toward the longer latency”8
Advertising materials for these type of projectors may use the term “response time” to describe a portion of video latency rather than something similar to LCD response time. See this video and article for details on how a DLP color wheel projector works.
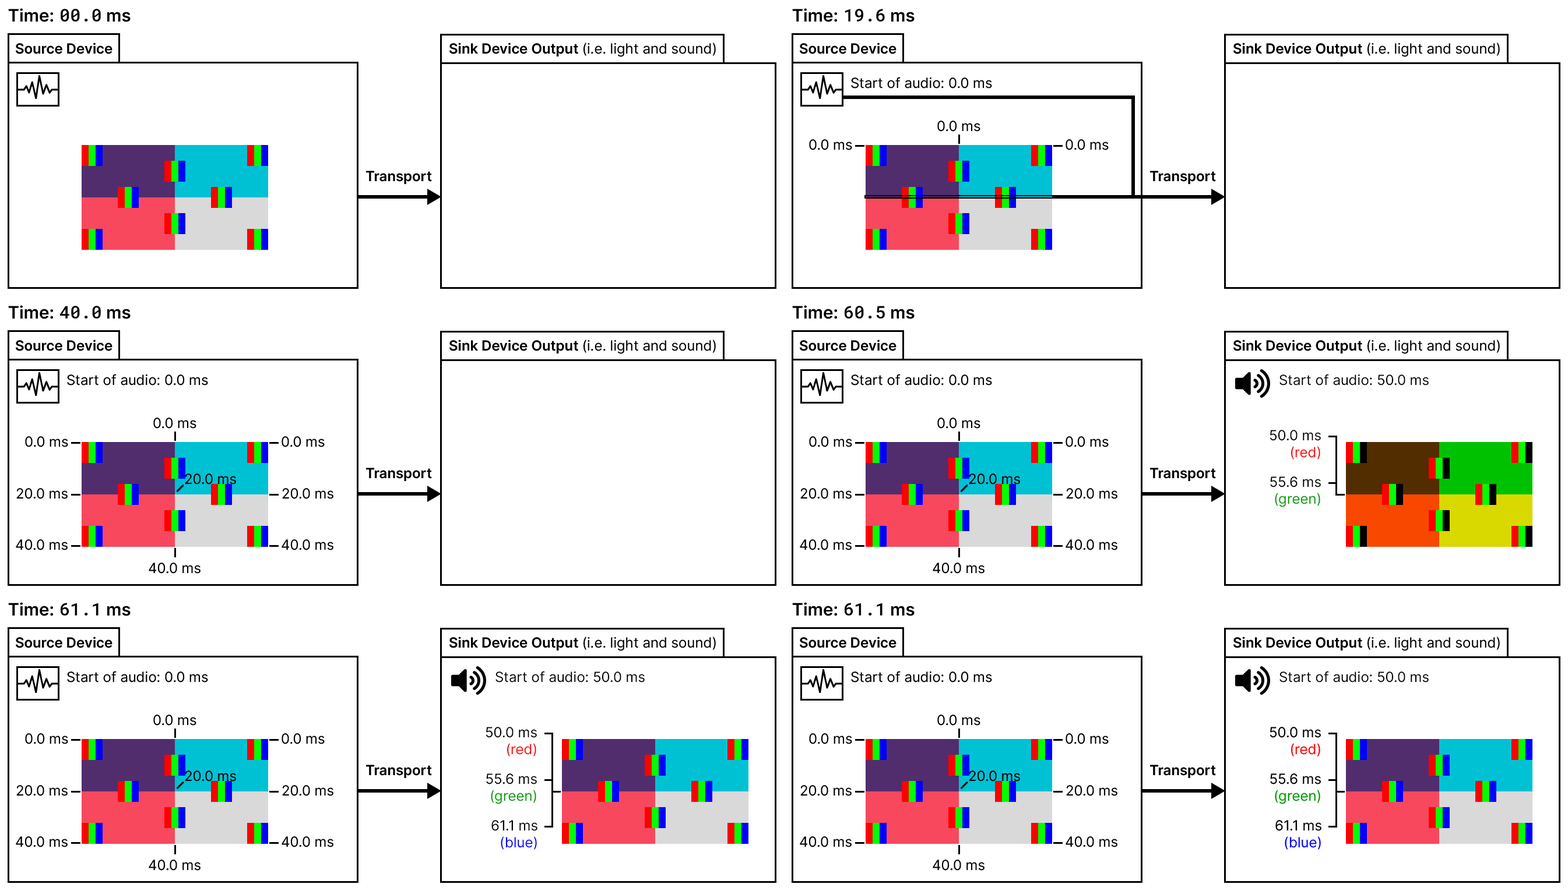
| Video latency (first primary color): | 50.0 ms − 20.0 ms = 30 ms |
| Video latency (complete color presentation): | 61.1 ms − 20.0 ms = 41 ms |
| Audio latency: | 50 ms − 0 ms = 50 ms |
| AV sync error: | 41 ms − 50 ms = -9 ms |
| Notes: | As described above, video latency should be measured at the time of complete color presentation, although most tools will report the video latency of the first pimary color. |
Inconsistent Backlight (Flicker)
The backlight strobing/flicker on some displays may cause latency measurements at the center of the screen to vary from frame to frame. Tools for measuring video latency may handle this scenario automatically by averaging results before displaying them to the user.
Modified Video
These are a few ways that a sink might process and modify a video signal. The resulting presentation may have an effect on how video latency should be measured for use in audio/video synchronization and interactive systems.
- Interpolated Frame Insertion (Motion Smoothing)
- Deinterlacing
- Deinterlacing with 3:2 Pull Down
Author’s note: These techniques are not yet in my field of expertise so I have chosen to omit these examples for now. Please let me know if you are an experienced in this field and would like to help with this.
Last updated on March 6th, 2023.
- IDMS v1.1, 10.3 Video Latency, “Description”
- Murideo 8K Seven Generator User Manual, “ARM AV LATENCY”
- Leo Bodnar tools: 6% of full luminosity, Harkwood Sync-One2: earliest detectable change
- IDMS v1.1, 10.3 Video Latency, Description
- IDMS v1.1, 10.3 Video Latency, “Reporting”
- DMD Mirrors in a DLP-Projector Moving in Slow Motion (Stroboscopic Effect)
- ITU-R BT.1359-1, Figure 2
- HDMI Specification 2.0, Section 10.6.1.3 “Supporting a Range of Latency Values”