The Leo Bodnar 4K HDMI Video Signal Lag Tester can be used to measure input lag of an HDMI sink device. It produces an HDMI video signal and presents the time until that video signal is detected by the optical sensor on the lag tester.
Video latency can be calculated based on this input lag measurement by simply subtracting an amount that is specific to the refresh rate of the video signal.
Index
Summary
- Accurately measures input lag excluding pixel response time.
- Does not correctly average measurements of 3:2 pull down.
4K Lag Tester Capabilities
The Leo Bodnar 4K Lag Tester supports the following HDMI 2.0 (TMDS) video formats:
| 3840x2160p 60.00Hz | 1920x1080p 60.00Hz | 1280x720p 60.00Hz |
| 3840x2160p 50.00Hz | 1920x1080p 50.00Hz | 1280x720p 50.00Hz |
| 3840x2160p 30.00Hz | 1920x1080p 30.00Hz | |
| 3840x2160p 25.00Hz | 1920x1080p 25.00Hz | |
| 3840x2160p 24.00Hz | 1920x1080p 24.00Hz |
The Leo Bodnar testers report the time between when the first active pixel leaves the FPGA and when its sensor detects the display has reached approximately 6% of full luminance.1 The tester outputs an 8-bit RGB HDMI signal with 750 lines, 1125 lines, and 2250 lines for 720p, 1080p, and 2160p respectively.2
Some earlier firmware versions of the fixed-resolution 720p/1080p testers measured from the start of blanking rather than the first pixel. This was changed with later versions to match the behaviour described in the previous paragraph.
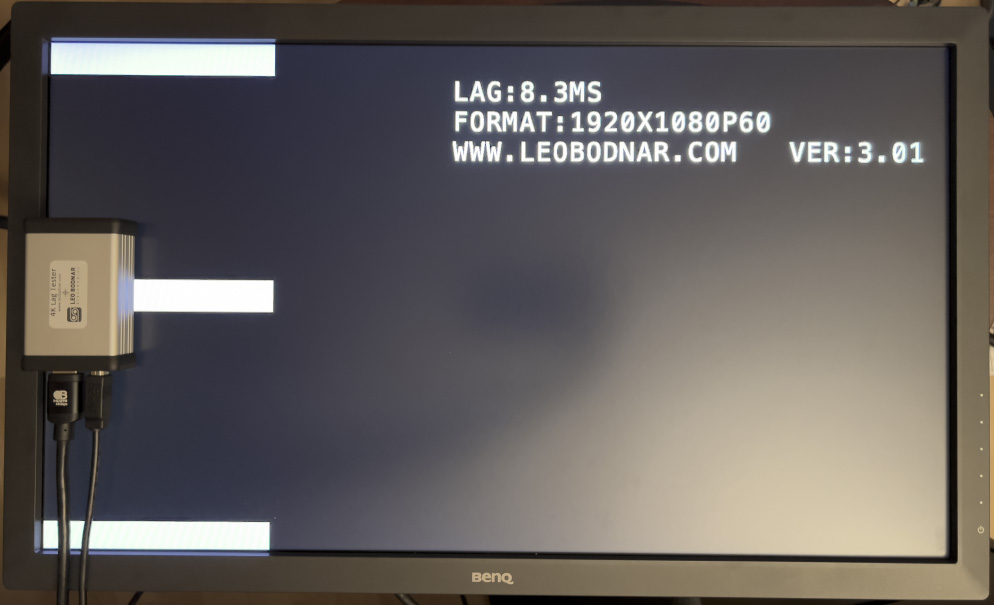
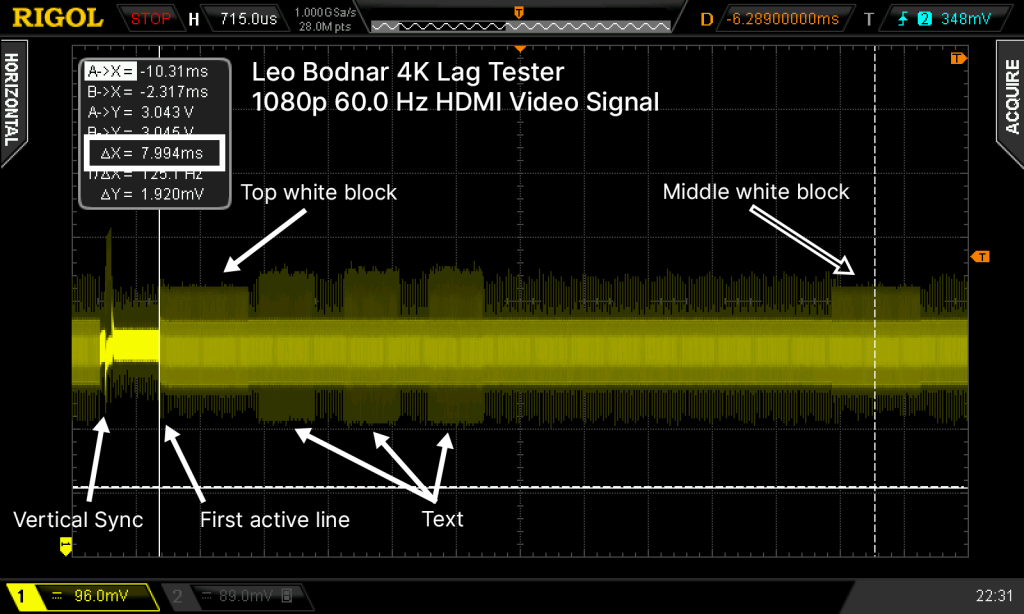
The time from the first line to the center of the middle white block, shown as 7.994 ms in this oscilloscope screenshot, is constant for each refresh rate that the tester outputs. Because of this, it is easy to calculate the video latency of device under test (DUT). Visit Measuring HDMI Video Latency for instructions on this simple calculation.
Flash Pattern
The Leo Bodnar lag testers rapidly flash a white rectangle on the screen. The following image shows the pattern displayed on an OLED display:
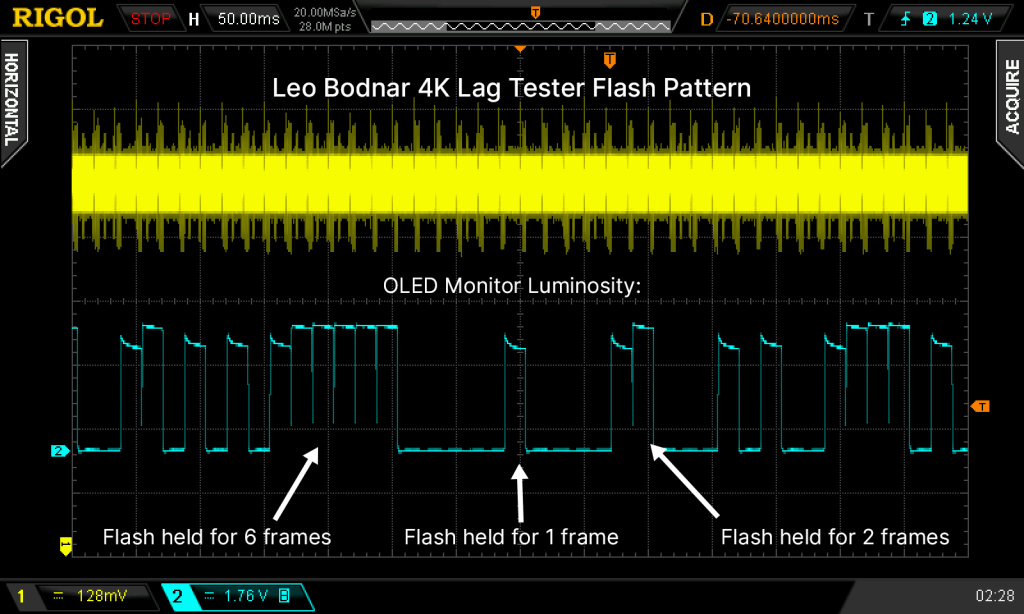
Test Overview
This review assesses the accuracy of measurements reported by the Leo Bodnar 4K video lag tester with the 3.0.1 firmware. Three types of displays are used in this test: an LCD gaming monitor, an LCD TV, and an OLED monitor. The LCD TV is used to assess the accuracy of average input lag measurements and the OLED monitor is used to assess the accuracy of a display with extremely fast pixel response time.
Accurate reference measurements were captured using an oscilloscope attached to a simple photodiode circuit. These measurements were compared with the results reported by the Leo Bodnar tester.
This review does not include any tests with a DLP projector, but I expect the results would only include the time until the first colour is presented. Otherwise, a DLP projector should behave similar to the OLED monitor from the perspective of the Leo Bodnar tester. For more information on accurately measuring video latency of DLP projectors, see the Advanced Topics in Video Latency and Audio/Video Synchronization page.
Reference Measurement
Before connecting the Leo Bodnar tester, I measured the input lag of a BenQ ZOWIE gaming monitor by using an HDMI output from an NVIDIA graphics card to display a fully black screen. I then made a single white line appear at the center of the screen and measured this transition using my oscilloscope. I chose the BenQ monitor because it has very consistent video latency between power cycles once the LCD panel has warmed up, which was not the behaviour that I saw with other devices.
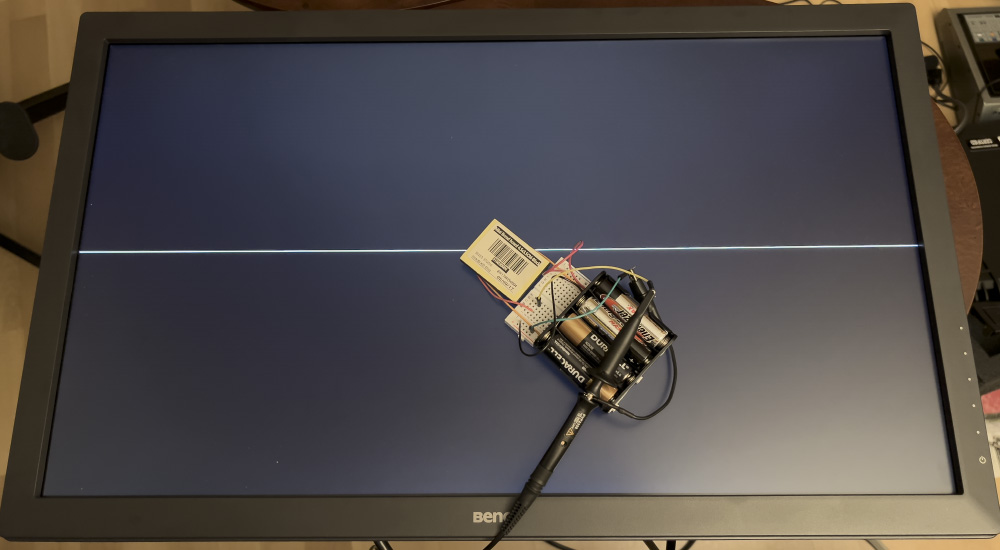
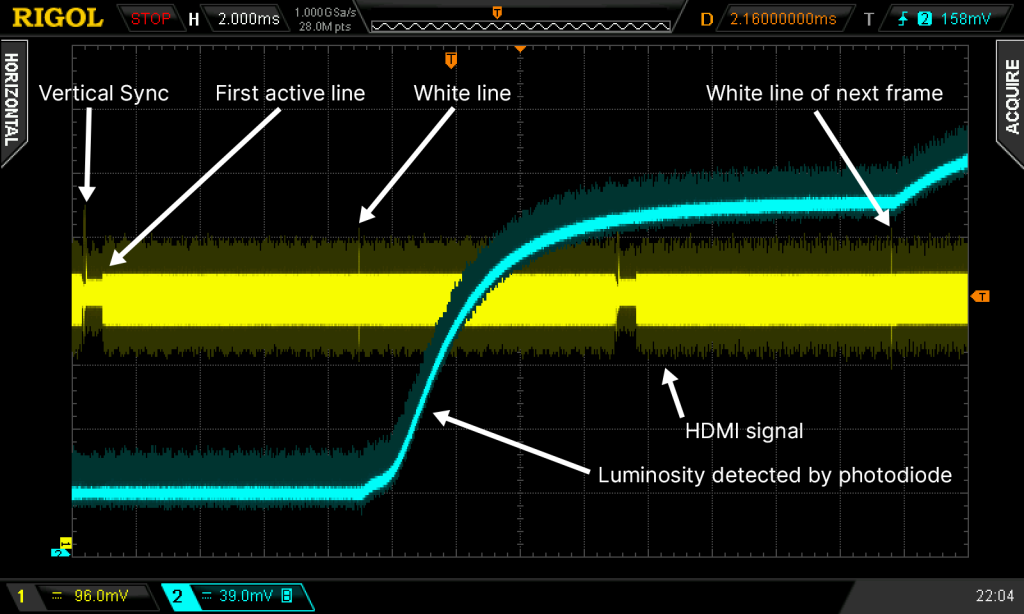
The input lag measurement, without pixel response time, is simply the time between the first active line of video and the first change in luminosity detected by the photodiode:
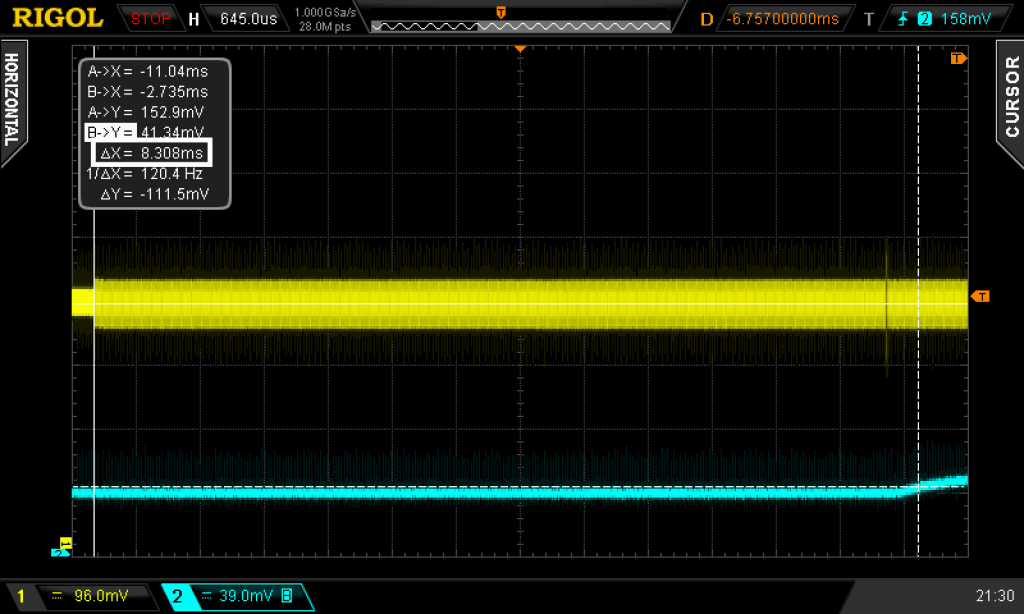
This measurement is 8.3 ms — exactly the same measurement that was reported by the Leo Bodnar 4K lag tester!

Average Input Lag
Some sink devices may have have a different video latency and input lag for each frame that is presented. An example of this is 3:2 pull down of a 24 Hz video signal on a 60 Hz display. In this case, half of the frames will have one video latency and the other half will have another video latency which causes an effect called “motion judder”. You can find out more about this behaviour on the Advanced Topics in Video Latency and Audio/Video Synchronization page. The LCD TV that I used in this test is an example of a sink device that makes use of 3:2 pull down to display a 24 Hz video signal.
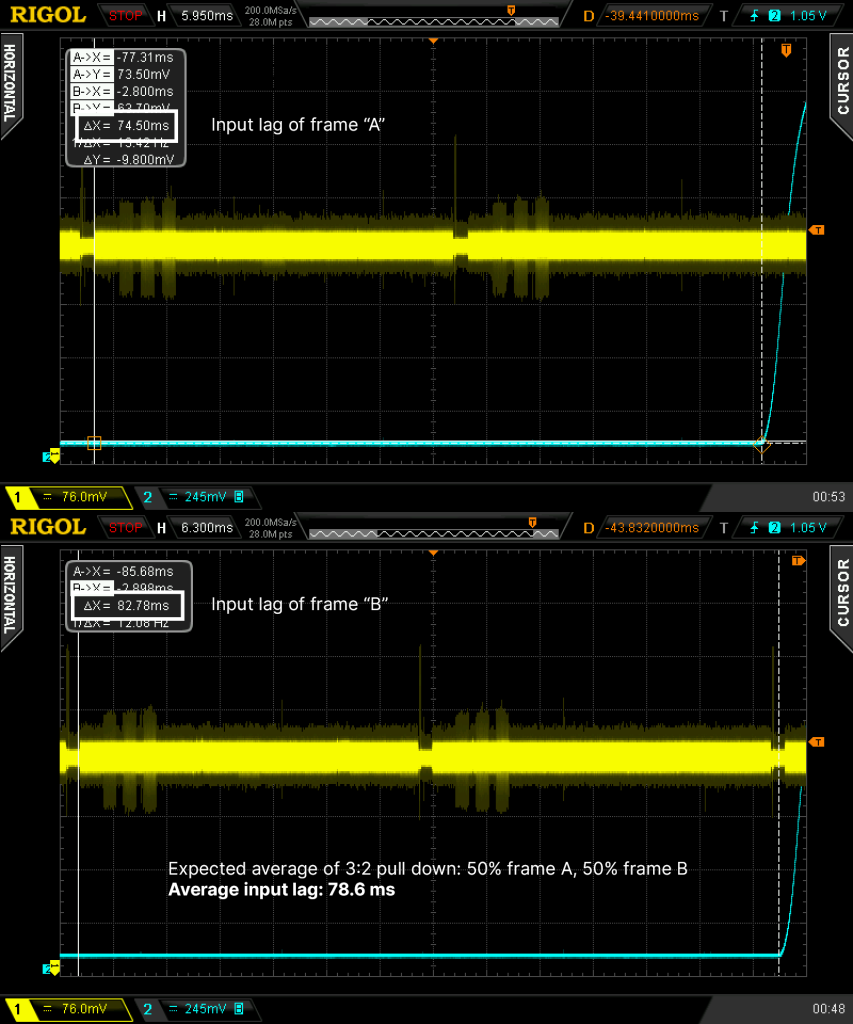
The oscilloscope clearly measured two different input lag values, as expected. The average input lag works out to be 78.6 ms. Let’s see what the Leo Bodnar tester reports:
As seen in the video, the flashing pattern used by the Leo Bodnar tester does not enable the device to accurately measure average input lag for a video signal with 3:2 pull down. It seems that the pattern biases the average towards the input lag of frame “A” rather than the average of the two that are expected to have a distribution of 50% frame “A” and 50% frame “B”.
The oscilloscope measurements of the Leo Bodnar video signal were taken at the same time that the video was recorded to ensure that this difference in average input lag was not introduced by a change in video latency caused by power cycling or re-syncing the TV.
OLED Display
OLED displays give an interesting challenge to a device like this lag tester because it takes far less than 0.1 ms for the display to reach full luminosity, unlike LCDs. This pushes the rise time of the light detector to its limits. The OLED panel that I have also uses pulse width modulation to adjust the brightness of the display, which could impact how a light sensor performs.
Again, I used my photodiode to measure the input lag alongside the Leo Bodnar tester and compared the results:
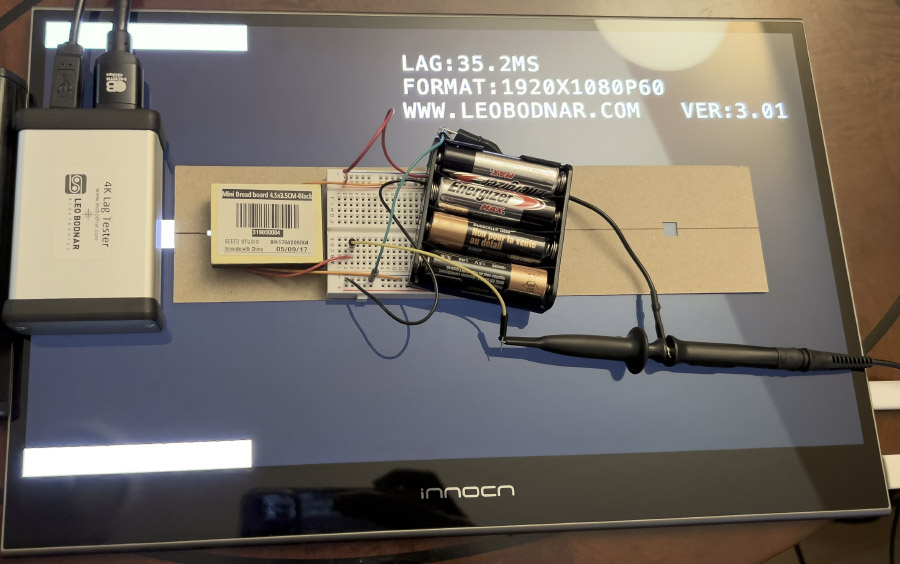
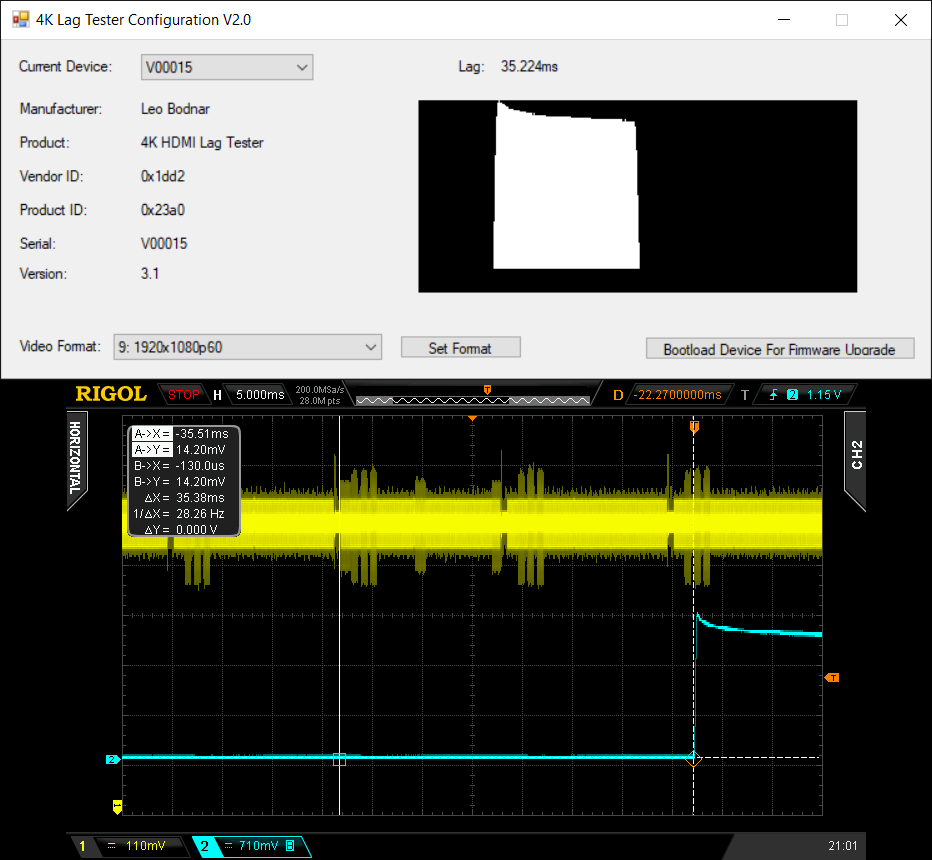

I noticed a 0.2 ms difference between my measurements and the Leo Bodnar measurements. After a bit of playing around, I was able to determine that the cause of this is the small size of this 15″ OLED display: the light from the top of the middle white rectangle is detected by the Leo Bardnar tester, which results in lower input lag measurements than expected. This would not be the case with a larger screen because the tester’s light sensor would be more precisely focused on the center of the middle rectangle. This middle rectangle is scanned out to the HDMI video signal over a period of 1.0 ms, so you can get a different reading by positioning the device at different vertical positions on the rectangle.
I was able to confirm this was the case by positioning both my photodiode and the Leo Bodnar tester at the top of the middle rectangle to ensure no light bleed from earlier video lines were skewing measurements. This resulted in the exact same value from my photodiode and the Leo Bodnar tester:
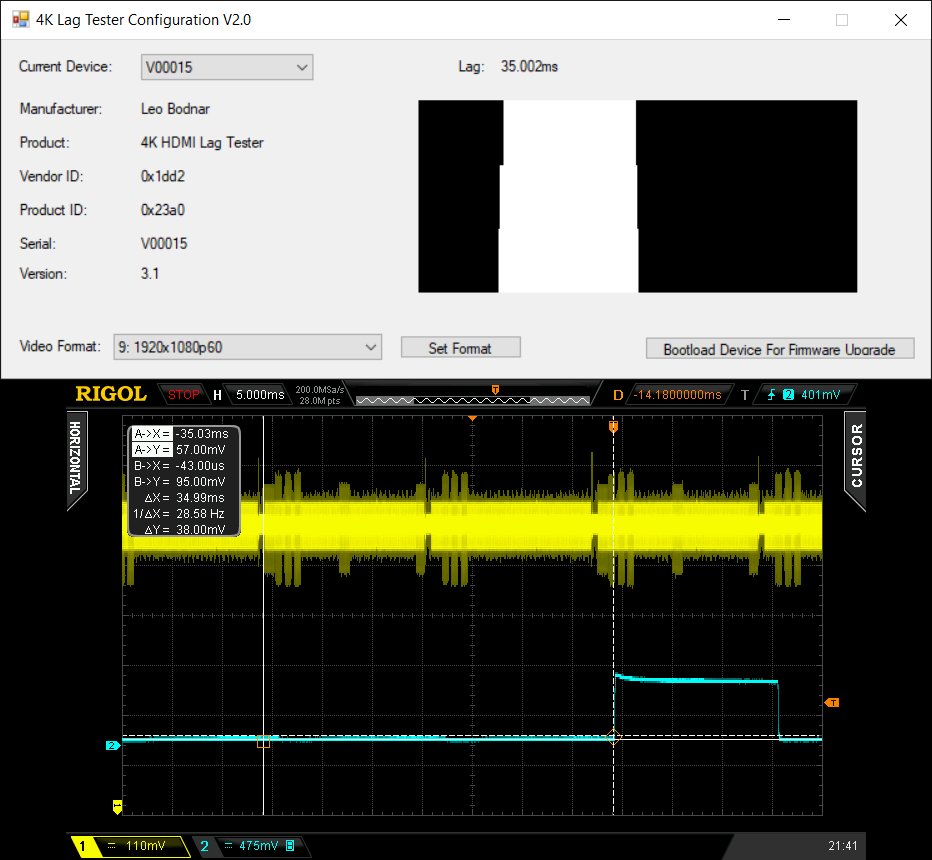
All this to say, the performance of the Leo Bodnar tester was spot-on accurate for use with an OLED display, even with pulse width modulation for brightness control.
Tests performed with firmware version 3.0.1.
Last updated on June 24th, 2022.